
House prices in England and Wales rallied to a new peak in May, according to Your Move’s latest England & Wales House Price Index.
The uncertainty of a General Election did little to dampen the market, with the average price up 0.3% to £303,200. The value of the average home has now increased £13,934, or 4.8%, in the last 12 months.
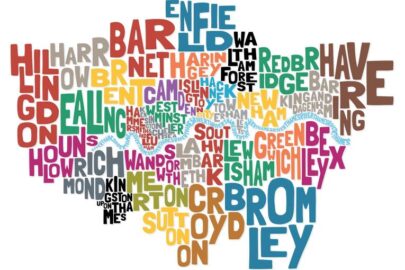
Activity remained relatively strong, too, with transactions slightly lower than usual for the season but still up 6% on April, with an estimated 62,500 sales. A sharp slowdown in sales in London, the South East and East of England is increasingly being offset by more resilient performance in the North.
Oliver Blake, managing director of Your Move and Reeds Rains estate agents, said: “There was a lot of talk about housing from the parties in their election manifestos; it’s now time for those words to be put into action.
“The market remains resilient and there’s encouraging activity in the North, but we need to urgently address the serious blockages in house building holding back labour mobility and economic competitiveness in too many areas of the country.”
Transactions in the North East (up 10%), North West (6%), Yorks & Humberside (7%), East Midlands (4%), West Midlands (6%) and Wales (13%) are all higher in the three months to the end of April 2017 than the same period in 2015; transactions in high-priced areas such as Greater London and the South East are down (by 19% and 7% respectively).
The slowdown in transactions in London has continued in the last year. Sales in the three months to the end of April are now 29% lower than the same period last year. Prices continue to rise, up 2.7% in the year to April 2017, but this is the second lowest annual rise seen in London since March 2012.
The average price in the capital at the end of April stood at £615,838, up 0.1% on the month before.
Despite the overall slowdown in the London market, prime property in the capital is no longer suffering the worst of this. In fact, the two highest priced boroughs, Kensington and Chelsea (with average prices of £1,995,443) and the City of Westminster (reaching a new peak of £1,778,245) have both seen strong growth on an annual basis, up 8.8% and 9.7%, respectively. The City of London, meanwhile, saw the biggest monthly increase, up 9.6% to £998,709.
Over the year, the best performing borough is Haringey, with prices up 12.5%, driven by increases in flat prices; Islington, meanwhile, has performed worst, with prices down 10.4%, largely as a result of comparison with a surge in sales of terraced houses ahead of the 3% stamp duty surcharge on second homes introduced last year. Both boroughs are in the top third when it comes to prices.
Transaction activity patterns are clear in London. The number of sales in the three months from February to the end of April 2017 are down right across London compared to 2015 and 2016. Transactions have fallen least, however, in Havering, Newham and Bexley: three of cheapest four London boroughs.
In the regions, the West Midlands has now cemented its position as the UK’s property hotspot, leading annual house price growth for the third month running. Prices are up 5.1% in the year to April, despite a fall of 0.7% over the month. Shropshire, where prices have increased 7.4% annually, continues to lead growth in the region.
Of the country’s 108 unitary authorities, 88 (or 81%) have seen growth in the last year. Of the 20 to see falls, Wales has the most (five), but the region has also seen some of the highest increases in prices, led by the Isle of Anglesey, where they are up 15.7%, and Camarthenshire, up 13.2%. Ceredigion, with prices up 10.7% is also among the strongest growing authorities in the last year.
In England, the only authorities to manage similar double-digit growth are Buckinghamshire (up 10.7%) in the South East, and York (up 10.1%) in Yorks and Humber. Norfolk in the East of England comes close, though, with prices up 9.9%.
Overall, every region in England and Wales has grown in the last year, with the East of England (also up 5.1%) matching the West Midlands, and setting a new peak. The East Midlands (up 4.4%), South West (up 4.2%) and South East (4.1%) have also grown solidly.
Further north, the North East, up just 0.2%, continues to trail the rest of the market, but the North West has performed well with prices up 3.2% annually. It, too, set a new peak in April, largely as a result of strong growth in Merseyside where prices are up 6.2% in the last year. Increased Help to Buy activity is supporting the lower end of the market in North Liverpool, while high value new build sales in south Liverpool are boosting activity in properties priced from £300,000 up to £500,000.