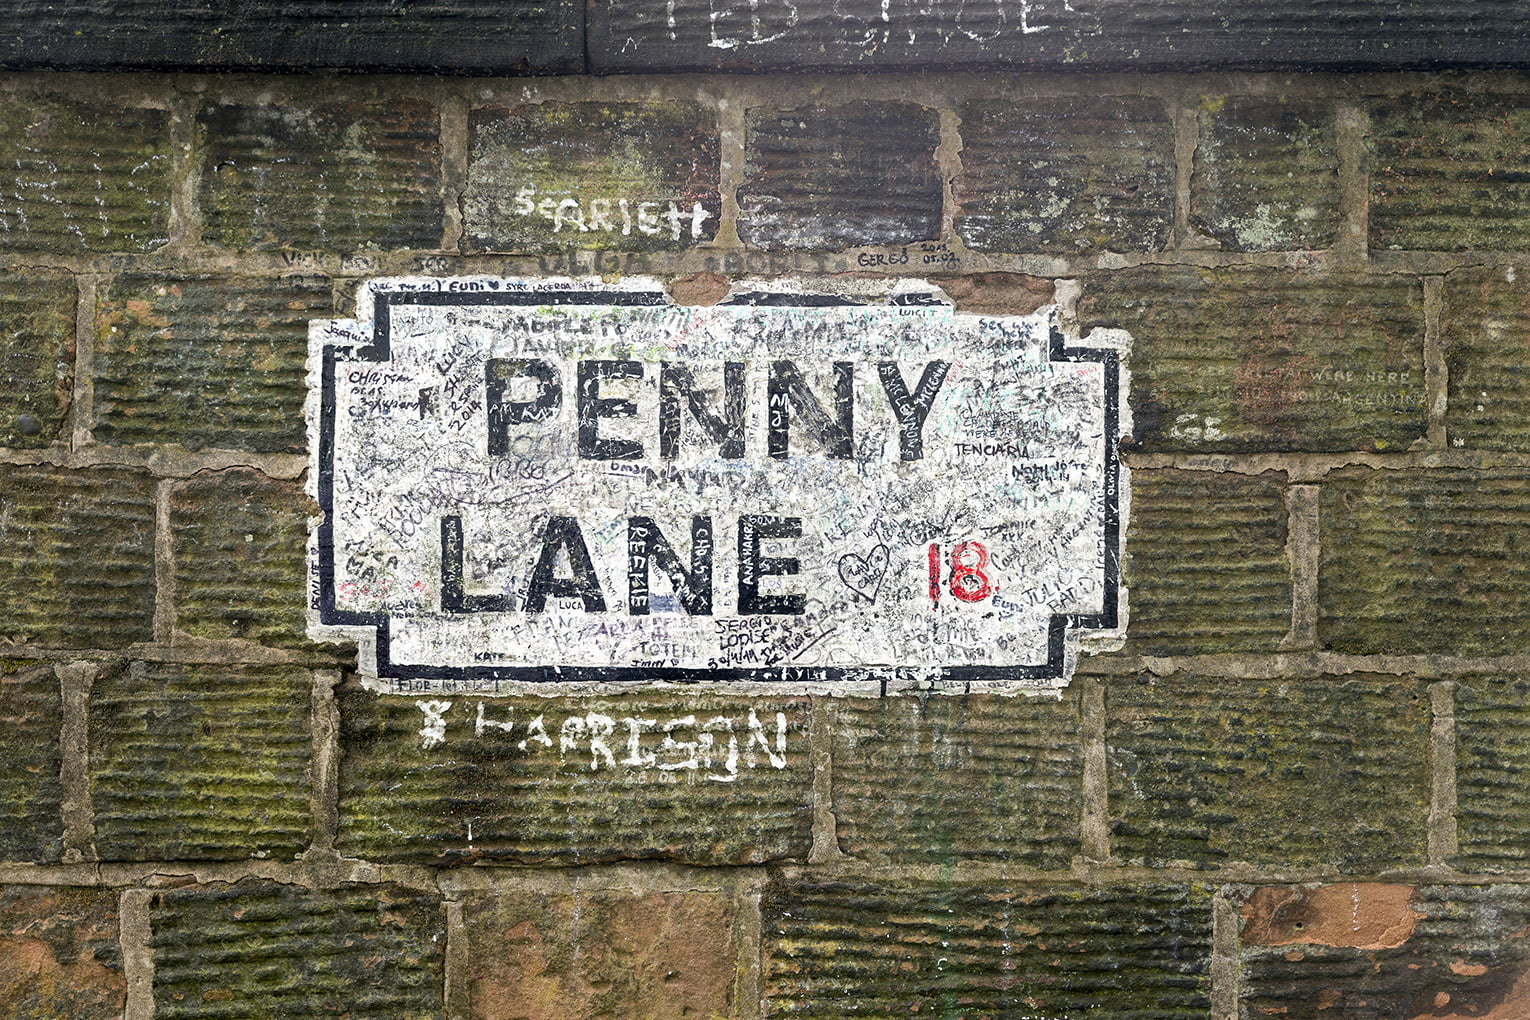
New research by Barclays Mortgages has found that homes sited on ‘lanes’ are worth over £100,000 more than those on a ‘street’.
The data, generated by findings provided by Hometrack, show that while homes on ‘lanes’ come in top at an average property value of £245,906 (22% higher than average), homes on ‘streets’ come towards the bottom of the list, with properties averaging £142,374 (29% under the average – and 42% lower than ‘lanes’) across the UK.
Just behind ‘lanes’ are the ‘ways’ and ‘roads’, with average values of £218,742 and £212,717 respectively, followed by ‘closes’ and ‘avenues’ at £204,964 and £192,344.
| Top 7 most valuable address types across the UK | ||
| Location | Average price (£) | Price relative to the total UK average |
| 1. Lane | 245,906 | 123% |
| 2. Way | 218,742 | 109% |
| 3. Road | 212,717 | 106% |
| 4. Close | 204,964 | 102% |
| 5. Avenue | 192,344 | 96% |
| 6. Drive | 191,675 | 96% |
| 7. Street | 142,374 | 71% |
| UK | 201,246 | 100% |
Regionally, the biggest divide in direct cost between street name prices occurs in the South East, where properties on ‘lanes’ are an average of £137,145 more expensive than those on ‘streets’ – while the most pronounced gap in price in relative terms is in Wales, with properties on ‘streets’ barely reaching half the value of those on ‘lanes’ (53%).
By contrast, the region with the least fluctuation in price is the East of England, where prices vary between the above street names by just 36%.
| Location | |||||||||
| Avenue | Close | Drive | Road | Lane | Street | Way | Average | ||
| Average price for region | East Midlands | £148,626 | £167,447 | £167,735 | £161,216 | £194,059 | £132,984 | £173,033 | £163,586 |
| East of England | £246,517 | £227,983 | £245,181 | £241,367 | £309,415 | £230,607 | £234,808 | £247,983 | |
| London | £437,621 | £332,948 | £402,222 | £440,645 | £414,122 | £566,406 | £379,926 | £424,841 | |
| North East | £123,802 | £139,711 | £150,458 | £117,832 | £150,644 | £78,474 | £142,523 | £129,063 | |
| North West | £139,961 | £155,633 | £166,093 | £145,735 | £178,805 | £92,960 | £154,682 | £147,696 | |
| Northern Ireland | £114,758 | £110,185 | £104,245 | £148,519 | £145,480 | £86,540 | £96,905 | £115,233 | |
| Scotland | £133,711 | £161,869 | £139,411 | £139,108 | £151,933 | £111,129 | £136,538 | £139,100 | |
| South East | £278,378 | £272,944 | £296,995 | £281,486 | £396,563 | £259,418 | £285,237 | £295,860 | |
| South West | £220,058 | £206,621 | £223,364 | £220,194 | £277,489 | £190,312 | £211,645 | £221,383 | |
| Wales | £143,193 | £157,185 | £163,328 | £143,521 | £190,039 | £101,280 | £156,838 | £150,769 | |
| West Midlands | £158,082 | £168,115 | £175,398 | £160,643 | £201,204 | £121,243 | £166,817 | £164,500 | |
| Yorkshire & the Humber | £135,857 | £152,910 | £158,995 | £139,132 | £171,334 | £106,025 | £157,389 | £145,949 | |
Comparing this to data released in 2001, all of the street names have hugely increased in average value in the last 15 years. The average price for a ‘lane’ property has doubled, from approximately £123,000 in 2001 to the £246,000 of last year, while even ‘streets’ have jumped up from £92,000 to £142,000.
Craig Calder, Barclays’ director of mortgages, said: “As this data highlights, the last few years have been incredibly buoyant for the housing market and economy, and this is great news for buyers and sellers across the nation.
“While this data paints a clear picture of victory for ‘lanes’ in the competition between properties, it’s interesting to see the varying statistics from around the country, and a huge growth in value overall.”


